


Getting started with OvuSense® Pro
This page describes what you need to do to get up and running with OvuSense Pro. If you want to learn more about how OvuSense Pro works first, click on one of the buttons below.
Share Data
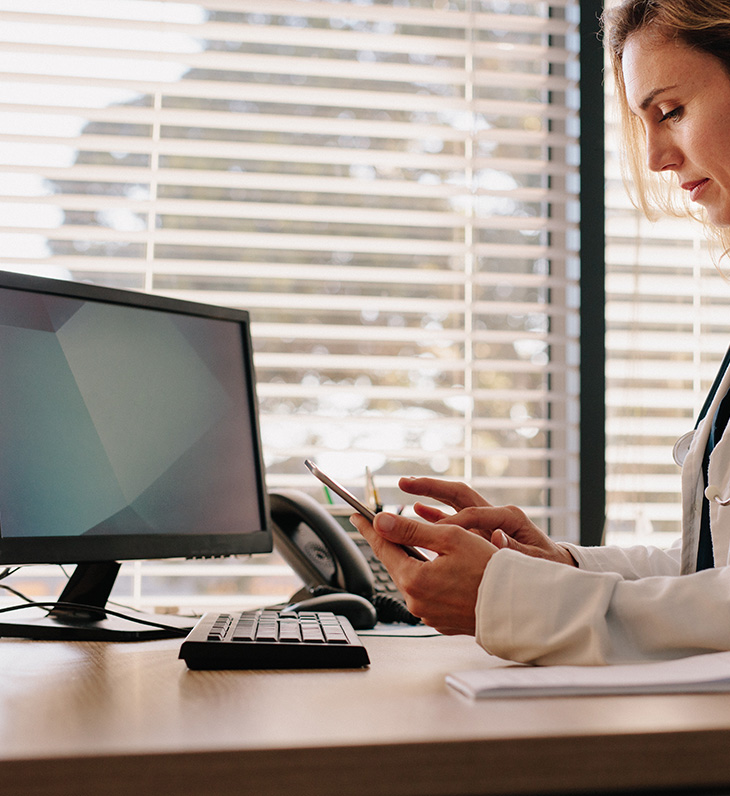
The next step is for the user to share her OvuSense App data with her OB/GYN or specialist. To do this the OvuSense user should login to the OvuSense App, then follow the steps below.
Set up sharing for OvuSense Pro
If you're and OvuSense user and have already purchased an OvuSense Pro subscription or plan to, you'll need to share your data with your medical professional using the following steps:
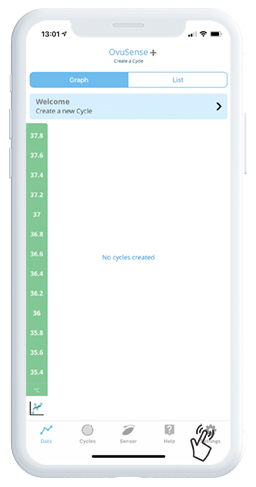
a - Tap on the Settings icon in the menu bar
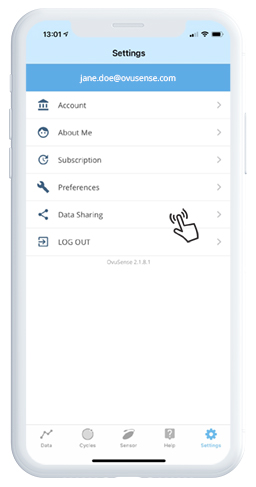
b - Tap 'Data Sharing'
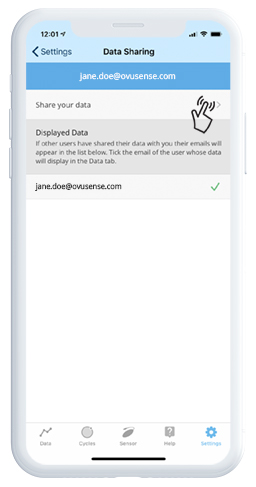
c - Tap 'Share your data'
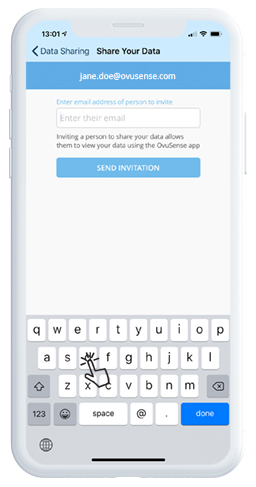
d - Enter the email address your medical professional is using to access OvuSense Pro
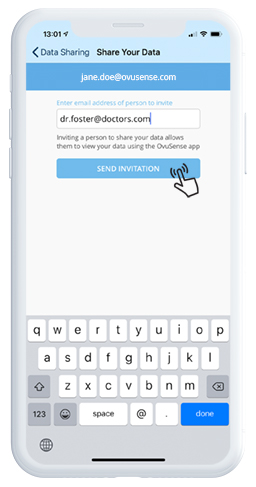
e - Tap on Send Invitation
Access OvuSense Pro
Once user and medical professional have each set up your OvuSense Pro subscriptions, and the OvuSense user has shared her data with her medical professional, both can access the OvuSense Pro portal. The Pro portal is accessible from any web browser on a desktop, laptop or mobile device with the address: pro.ovusense.com, click here now to sign in using your OvuSense App details. The OvuSense Pro portal is smartphone and tablet friendly but the best viewing experience is on a desktop or laptop.

Using OvuSense ® Pro
.

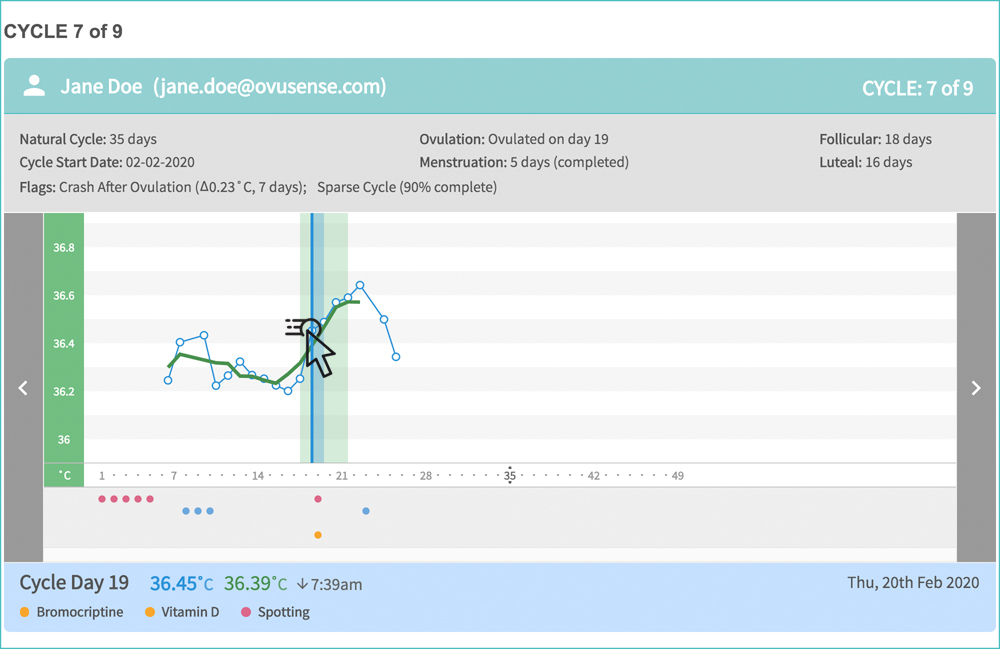
The Cycles screen lists of all of the cycles for an individual user. This is the first screen an OvuSense user will see when they sign in to OvuSense Pro. Each of the recorded cycles is listed in date order from oldest to newest with detailed OvuSense Pro analysis provided right there in the list under the Flags heading.

Some of the flags will tell you the amount of rise or fall in the curve after the Δ symbol, and the number of days after that flag occurred or the day on which it occurred. So, for instance, 'Crash After Ovulation (Δ 0.23˚C, 7 days)' means that there was a fall in temperature from the peak after ovulation of 0.23˚C, and it happened 7 days after ovulation. You can find out more about each unique OvuSense Pro analysis by clicking on each of the example charts below this section. You can change the temperature display from ˚C to ˚F in the Preferences section of the Menu. This is also where you can add gridlines to the charts. Click Dashboard on the Menu to return to your top screen in OvuSense Pro. Clicking on Refresh in the Menu updates to the latest recorded chart data (note this is important if your patient has just downloaded new data to OvuSense and you and they want to see the results in OvuSense Pro). The rest of the Menu allows you to provide Feedback, check your Account details and Logout.

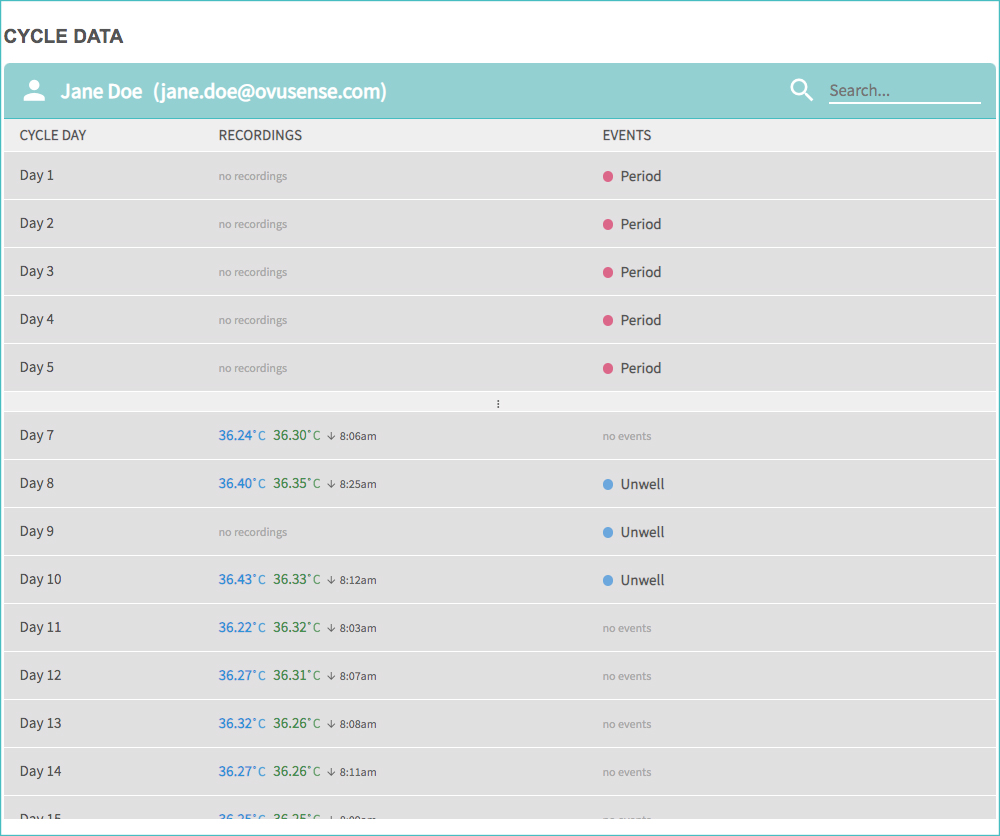
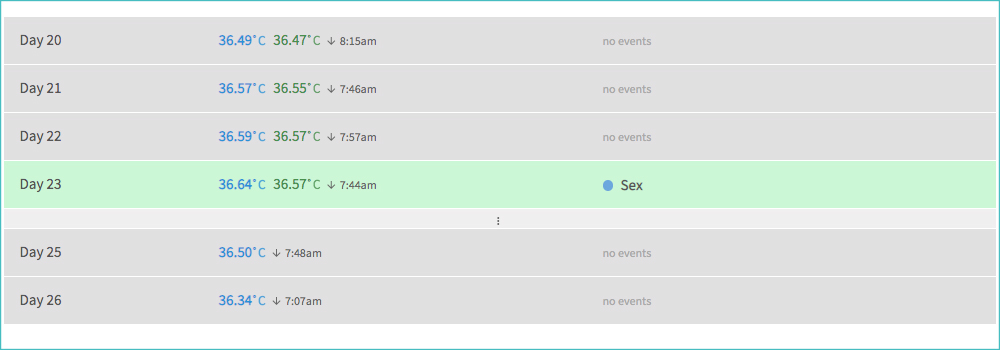
If you click on an individual cycle in the Cycles list, you'll then see the complete detail for that cycle including the OvuSense Pro analysis and cycle chart at the top of the screen, and a list of events at the bottom of the screen. You can move between cycles using '<' and '>' arrows, and if you move your mouse cursor across the chart in desktop/ laptop mode you'll highlight the details of individual data point including the events recorded for that cycle day.
.
OvuSense Pro analysis
OvuSense Pro provides in-depth cycle pattern analysis, automatically flagging each cycle pattern type identified below.
Click on each of the cycle pattern images below to find out more - for each image we answer the questions:
- What is it?
- How common is it?
- Why does it happen?
- How can I see it?.
- What does it mean?
- What can be done about it?
If you're interested in learning more about the exact details of how OvuSense Pro works, please click here to read the OvuSense Pro user guide.